Results
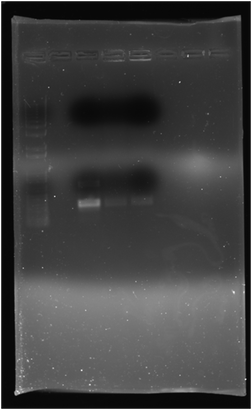
The purpose of the PCR was to amplify the DNA containing the VMAT2 gene. There is not a clear way to measure the efficiency of this reaction without creating a way to isolate the VMAT2 gene. To do this, the experimenters used the process of gel electrophoresis. The original cheek cell concentration would not be sufficient to display a visible product on the agarose gel, but if the product was PCR amplified there should be a clear band that traveled further than the other bands on the gel after undergoing electrophoresis. Indeed, our gel displays a clear, visible PCR product about halfway down the gel at a position consistent with the predicted size of the PCR product (341 bp). Below is an image of the gel. On the far left is the sample 1kb ladder as a guide to show how far the DNA samples have traveled during electrophoresis. After a gap, the three lanes represent the three experimenters DNA samples, each with visible PCR product.

Below are the results of the gene sequencing. The larger allele frequency bar on each graph represents the more common, less spiritually inclined variant of both the general population (expected) and the 38 Bethel students (observed). Similarly, the smaller allele frequency bar on each graph represents the rare variation that supposedly aides in individual's spiritual awareness. The higher one allele frequency is, the lower the other will be for a given population. For this reason, we will only focus our efforts on one allele frequency, the minor (less frequent) allele.
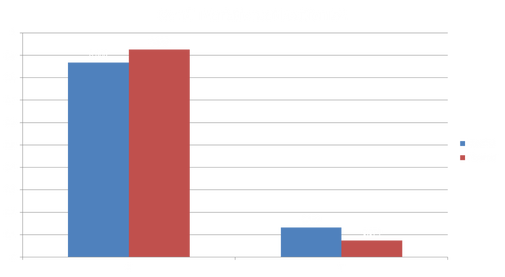
Figure 1. C (Cytosine) and T (Thymine) Variations at Position 52. 13.2% of the average population expressed the minor allele T at position 52 in the VMAT2 gene sequence. Bethel students displayed T allele frequency at a rate of 7.4%, a value lower than what is seen in the average population.
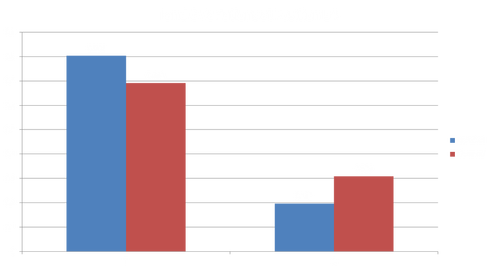
Figure 2. T (Thymine) and C (Cytosine) Variations at Position 54. 19.7% of the average population expressed the minor allele C at position 54 in the VMAT2 gene sequence. Bethel students displayed C allele frequency at a rate of 30.9%, a value higher than what is seen in the average population.
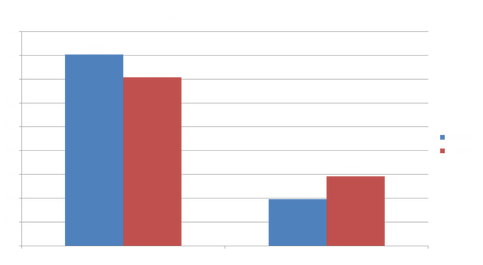
Figure 3. A (Adenine) and C (Cytosine) Variations at Position 71. 19.7% of the average population expressed the minor allele C at position 71 in the VMAT2 gene sequence. Bethel students displayed C allele frequency at a rate of 29.2%, a value higher than what is seen in the average population.
In summary, Bethel students had one minor allele frequency (number 52) lower than the average population and two minor allele frequencies (numbers 52 & 71) higher than the average population. To determine if either of these values were of significance, expected and observed minor allele frequencies were compared using a Chi Square. This yielded a significance value of 0.1515. The significance was not <0.05, thus the null hypothesis was accepted and the alternative hypothesis was rejected. Bethel students do not vary significantly from the general population in terms of relevant minor VMAT2 allele frequencies.
